eCommerce
The Most Important KPIs for all Ecommerce Merchants to Track

Oct 12, 2022


Running an ecommerce store can be tricky nowadays. The number of data points available has escalated massively over the last decade. This phenomenon has increased data access but has also made decision-making more complex. What metrics should I keep track of? Why are there so many acronyms? How do I distinguish between relevant, actionable metrics and irrelevant vanity metrics? These are all common questions brands encounter regularly. In order to simplify data analysis, selecting Key Performance Indicators (KPIs) is vital.
KPIs are the core metrics brands should track to ensure they meet their goals. They allow businesses to measure their performance at different sale stages. They also allow brands to create actionable items to improve their metrics. Lastly, ecommerce stores can use KPIs to benchmark their results against their competitors.
To understand conversion rates, it's essential first to define a conversion. This will vary depending on your business goals. For example, a conversion could be a sale, signing up for a course, downloading an app, etc.
A good rule of thumb is to define a conversion as an action that measurably impacts a business. Most ecommerce stores define conversions as sales.
The formula for conversion rate is as follows:

Google Analytics can also assist with conversion rates by automating the calculation. Shopify stores can also automate the calculation through its tool, Shopify Analytics.
Brands should then benchmark their results against their specific industry standards and main competitors. Benchmarking tools such as Varos can assist with this. Lastly, stores can leverage Conversion Rate Optimization (CRO) strategies to improve their performance.
AOV measures the average total of every order placed in an ecommerce store over a defined period. Brands can leverage this metric to determine critical business decisions, such as ad spend and product placement.
The formula for AOV is as follows:

For Shopify Stores, its analytics feature can segment AOV into different cohorts, such as new and returning customers. Brands can then leverage AOV to develop strategies to increase it, such as bundling products.
CLTV stands for the total value of a customer to a brand during the entirety of their relationship. This metric is based on revenue, distinguishing it from other metrics such as Net Promoter Score (NPS), which is based on user experience. CLTV's formula is as follows:

For example, if the Average Order Value is $50 once a month, and the average customer lifespan is 10 months, the CLTV would equal $500.
CLTV can also be further broken down into different channels and periods. Google can also assist in its calculation through its Google Analytics' Lifetime Value Report. Brands can then define customer segments and analyze CLTV for each, allowing for more granular analysis.
Cart Abandonment rate is the percentage of users from an ecommerce store who add products to their cart but don't complete their purchase. This metric will help determine how user-friendly and intuitive a brand's checkout process is.
The formula to calculate it is as follows:

Tools such as Google and Shopify Analytics can also help businesses track this metric. Once determined, Cart Abandonment Rate can help flag potential issues with a brand's website experience. The underlying issues will require additional tracking metrics, such as site performance and speed. You'll be able to learn more about these on our blog on How to Improve Site Performance.
ROI measures the effectiveness of advertising efforts by comparing advertising expenses to revenue generated from them. This metric allows brands to determine the most profitable channels for their business.
The formula to calculate ROI is as follows:

Furthermore, brands can leverage software tools to calculate ROI, such as Google Analytics to help track which source the most sales are coming from, such as paid, newsletter, organic, etc. Ecommerce stores can then leverage this data to evaluate their overall business health and allocate budgets accordingly, scaling the ones that prove to be successful and pivoting strategy on those that aren’t profitable.
Bounce rate is the percentage of visitors that leave a webpage without taking action. A higher bounce rate would mean that the website has layout or content issues that need to be resolved. It might also be evidence of a discrepancy in messaging across different advertising channels. For example, if an ad is advertising a one-of-a-kind, high-end jewelry line, but the website only has mass-produced, low-quality pieces, they aren't likely to spend much time on the page.
The formula to calculate bounce rate is as follows:

Google Analytics also has a feature to track bounce rates. Once a brand has defined its bounce rate, it can then put in place strategies to decrease it, such as implementing changes in website layout.
Return on Ad Spend (ROAS) is a metric used to calculate the total revenue generated per advertising dollar. Historically, this had been media buyer’s north start, meaning that it guided optimizations and determined the success of specific campaigns and creatives. However, since the implementation of iOS14, its accuracy has decreased, making it crucial to leverage first-party data through other metrics, such as Marketing Efficiency Ratio (MER), also known as blended ROAS.
The formula for ROAS and MER are as follows:


Facebook, Google, and TikTok Ads Manager can all calculate ROAS at the campaign level. However, as stated before, be mindful that this is now a modeled metric, meaning that the results registered will not match those in your store.
ROAS differs from ROI because it offers a more granular analysis, whereas ROI focuses on the overall strategy. Ecommerce stores can leverage ROAS to optimize specific channels and campaigns.
CTR is the number of link clicks your ad receives divided by the number of times your ad is shown. A higher CTR means that a higher percentage of viewers are engaging and clicking on your ad. CTR can also be further broken down into different types of clicks, the most relevant of which is link click.
A brand's CTR analysis should focus on link clicks specifically. Otherwise, the metric will consider all clicks, which might include clicks that are not relevant performance indicators. Businesses can then optimize their ads accordingly, such as testing different ad copy and creatives.
The formula for CTR is as follows:

CPC measures the average amount paid for each click. It's a measure most often used to determine the cost of an ecommerce store's advertising efforts. CPC can also be further broken down into different types of clicks, the most relevant of which is link click.
CPC's formula is as follows:

Just like with CTR, it's important to note that brands should focus on the link cost-per-click rather than all clicks, which might not be relevant performance indicators.
CPM stands for the cost per 1,000 impressions. A common misconception is that CPM reflects the cost per 1,000 users. However, impressions are the number of times an ad was viewed without considering the frequency with which each individual views the ad. This means that if one person views the ad twice, that would count as 2 impressions.
CPM's formula is as follows:

The lower your CPMs, the more times your ads will be shown with your current budget. To ensure a lower CPM, ecommerce stores' ads should be relevant to the interests or keywords targeted.
CPA, also known as cost per conversion, determines the cost a brand pays for a user to take a desired action on their website through a paid ad. Similar to the conversion rate, the business will determine the specific action that will count as a conversion.
The formula to calculate CPA is as follows:
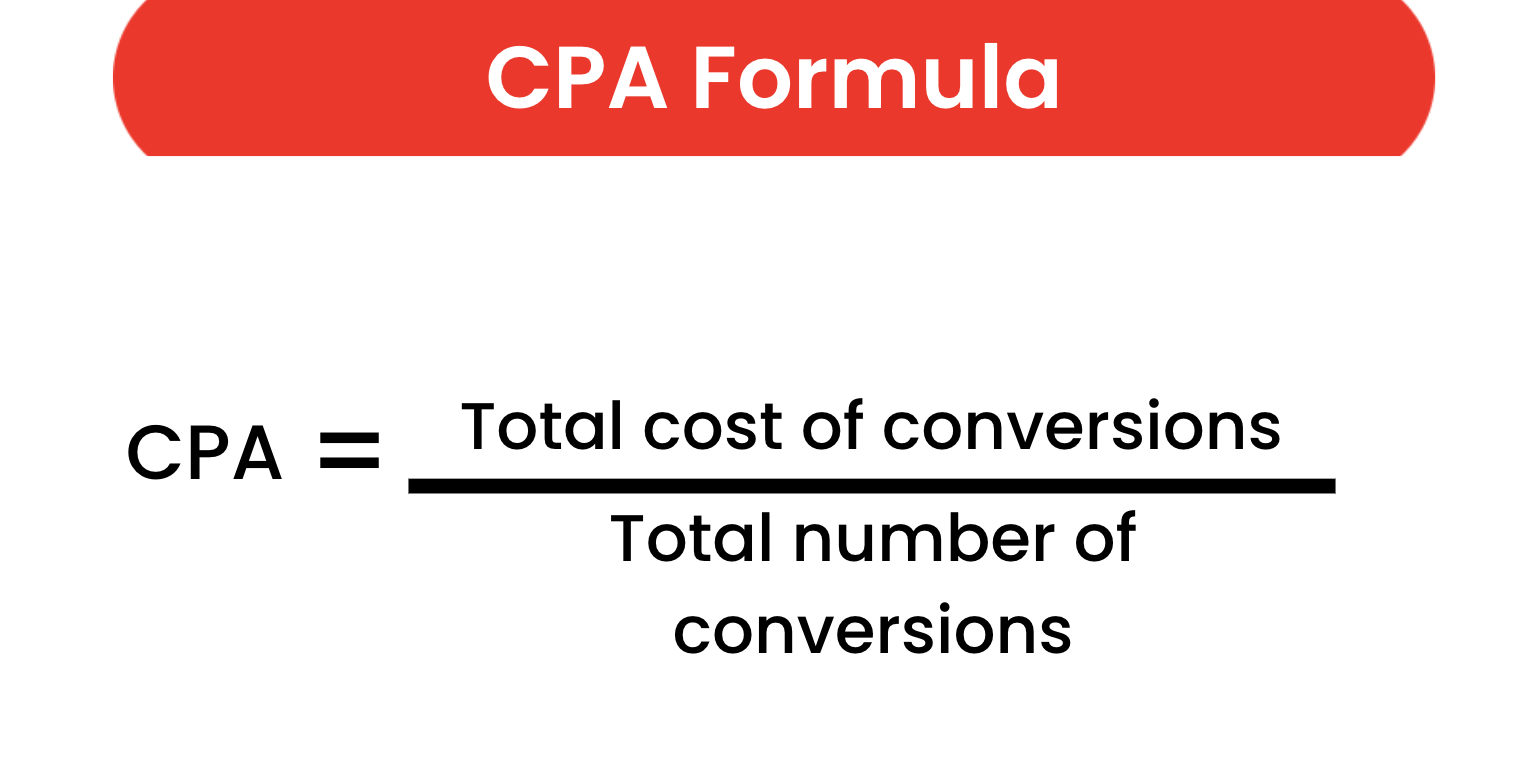
CPA reflects how well a brand's ads are landing with their audiences. A higher CPA means that a brand's campaigns are not connecting with their intended audiences, indicating that copy and creative changes should be made.
Lastly, it's important to note that these metrics alone won't provide brands with the data needed to scale their businesses. To do that, brands need to leverage the metrics and benchmark them within their industries. Furthermore, brands must develop actionable items based on their results. With these 11 KPIs, brands can begin their journey to optimize their brands and scale their businesses. Utilizing third-party software can also be helpful in analyzing the data from these metrics. At Shoelace, we use Whatagraph, a reporting tool that allows users to easily create reports, monitor trends, and discover insights based on their KPI results.
If you're still unsure about what KPIs to track or how to develop actionable items based on your results, our knowledgeable Growth Partners are happy to answer any questions! Connect with us here to learn more about how we can help.
Also, check out our free Black Friday / Cyber Monday Prep Guide for Ecommerce businesses, where we discuss more KPI's and break down all the prep work that needs to be done to make sure you have a successful holiday season! Get your copy of the guide here.
We’re looking to partner with brands that understand that true growth takes time and a strong foundation. We’ll help you build that foundation, and use it to grow your business. You won’t always love what we have to say, but you’ll love the end results.
Connect with Shoelace 👋

Running an ecommerce store can be tricky nowadays. The number of data points available has escalated massively over the last decade. This phenomenon has increased data access but has also made decision-making more complex. What metrics should I keep track of? Why are there so many acronyms? How do I distinguish between relevant, actionable metrics and irrelevant vanity metrics? These are all common questions brands encounter regularly. In order to simplify data analysis, selecting Key Performance Indicators (KPIs) is vital.
KPIs are the core metrics brands should track to ensure they meet their goals. They allow businesses to measure their performance at different sale stages. They also allow brands to create actionable items to improve their metrics. Lastly, ecommerce stores can use KPIs to benchmark their results against their competitors.
To understand conversion rates, it's essential first to define a conversion. This will vary depending on your business goals. For example, a conversion could be a sale, signing up for a course, downloading an app, etc.
A good rule of thumb is to define a conversion as an action that measurably impacts a business. Most ecommerce stores define conversions as sales.
The formula for conversion rate is as follows:
Google Analytics can also assist with conversion rates by automating the calculation. Shopify stores can also automate the calculation through its tool, Shopify Analytics.
Brands should then benchmark their results against their specific industry standards and main competitors. Benchmarking tools such as Varos can assist with this. Lastly, stores can leverage Conversion Rate Optimization (CRO) strategies to improve their performance.
AOV measures the average total of every order placed in an ecommerce store over a defined period. Brands can leverage this metric to determine critical business decisions, such as ad spend and product placement.
The formula for AOV is as follows:
For Shopify Stores, its analytics feature can segment AOV into different cohorts, such as new and returning customers. Brands can then leverage AOV to develop strategies to increase it, such as bundling products.
CLTV stands for the total value of a customer to a brand during the entirety of their relationship. This metric is based on revenue, distinguishing it from other metrics such as Net Promoter Score (NPS), which is based on user experience. CLTV's formula is as follows:
For example, if the Average Order Value is $50 once a month, and the average customer lifespan is 10 months, the CLTV would equal $500.
CLTV can also be further broken down into different channels and periods. Google can also assist in its calculation through its Google Analytics' Lifetime Value Report. Brands can then define customer segments and analyze CLTV for each, allowing for more granular analysis.
Cart Abandonment rate is the percentage of users from an ecommerce store who add products to their cart but don't complete their purchase. This metric will help determine how user-friendly and intuitive a brand's checkout process is.
The formula to calculate it is as follows:
Tools such as Google and Shopify Analytics can also help businesses track this metric. Once determined, Cart Abandonment Rate can help flag potential issues with a brand's website experience. The underlying issues will require additional tracking metrics, such as site performance and speed. You'll be able to learn more about these on our blog on How to Improve Site Performance.
ROI measures the effectiveness of advertising efforts by comparing advertising expenses to revenue generated from them. This metric allows brands to determine the most profitable channels for their business.
The formula to calculate ROI is as follows:
Furthermore, brands can leverage software tools to calculate ROI, such as Google Analytics to help track which source the most sales are coming from, such as paid, newsletter, organic, etc. Ecommerce stores can then leverage this data to evaluate their overall business health and allocate budgets accordingly, scaling the ones that prove to be successful and pivoting strategy on those that aren’t profitable.
Bounce rate is the percentage of visitors that leave a webpage without taking action. A higher bounce rate would mean that the website has layout or content issues that need to be resolved. It might also be evidence of a discrepancy in messaging across different advertising channels. For example, if an ad is advertising a one-of-a-kind, high-end jewelry line, but the website only has mass-produced, low-quality pieces, they aren't likely to spend much time on the page.
The formula to calculate bounce rate is as follows:
Google Analytics also has a feature to track bounce rates. Once a brand has defined its bounce rate, it can then put in place strategies to decrease it, such as implementing changes in website layout.
Return on Ad Spend (ROAS) is a metric used to calculate the total revenue generated per advertising dollar. Historically, this had been media buyer’s north start, meaning that it guided optimizations and determined the success of specific campaigns and creatives. However, since the implementation of iOS14, its accuracy has decreased, making it crucial to leverage first-party data through other metrics, such as Marketing Efficiency Ratio (MER), also known as blended ROAS.
The formula for ROAS and MER are as follows:
Facebook, Google, and TikTok Ads Manager can all calculate ROAS at the campaign level. However, as stated before, be mindful that this is now a modeled metric, meaning that the results registered will not match those in your store.
ROAS differs from ROI because it offers a more granular analysis, whereas ROI focuses on the overall strategy. Ecommerce stores can leverage ROAS to optimize specific channels and campaigns.
CTR is the number of link clicks your ad receives divided by the number of times your ad is shown. A higher CTR means that a higher percentage of viewers are engaging and clicking on your ad. CTR can also be further broken down into different types of clicks, the most relevant of which is link click.
A brand's CTR analysis should focus on link clicks specifically. Otherwise, the metric will consider all clicks, which might include clicks that are not relevant performance indicators. Businesses can then optimize their ads accordingly, such as testing different ad copy and creatives.
The formula for CTR is as follows:
CPC measures the average amount paid for each click. It's a measure most often used to determine the cost of an ecommerce store's advertising efforts. CPC can also be further broken down into different types of clicks, the most relevant of which is link click.
CPC's formula is as follows:
Just like with CTR, it's important to note that brands should focus on the link cost-per-click rather than all clicks, which might not be relevant performance indicators.
CPM stands for the cost per 1,000 impressions. A common misconception is that CPM reflects the cost per 1,000 users. However, impressions are the number of times an ad was viewed without considering the frequency with which each individual views the ad. This means that if one person views the ad twice, that would count as 2 impressions.
CPM's formula is as follows:
The lower your CPMs, the more times your ads will be shown with your current budget. To ensure a lower CPM, ecommerce stores' ads should be relevant to the interests or keywords targeted.
CPA, also known as cost per conversion, determines the cost a brand pays for a user to take a desired action on their website through a paid ad. Similar to the conversion rate, the business will determine the specific action that will count as a conversion.
The formula to calculate CPA is as follows:
CPA reflects how well a brand's ads are landing with their audiences. A higher CPA means that a brand's campaigns are not connecting with their intended audiences, indicating that copy and creative changes should be made.
Lastly, it's important to note that these metrics alone won't provide brands with the data needed to scale their businesses. To do that, brands need to leverage the metrics and benchmark them within their industries. Furthermore, brands must develop actionable items based on their results. With these 11 KPIs, brands can begin their journey to optimize their brands and scale their businesses. Utilizing third-party software can also be helpful in analyzing the data from these metrics. At Shoelace, we use Whatagraph, a reporting tool that allows users to easily create reports, monitor trends, and discover insights based on their KPI results.
If you're still unsure about what KPIs to track or how to develop actionable items based on your results, our knowledgeable Growth Partners are happy to answer any questions! Connect with us here to learn more about how we can help.
Also, check out our free Black Friday / Cyber Monday Prep Guide for Ecommerce businesses, where we discuss more KPI's and break down all the prep work that needs to be done to make sure you have a successful holiday season! Get your copy of the guide here.

.webp)